https://doi.org/10.1351/goldbook.08062
Diagram indicating the causes of a specific event or condition.
Note: In analytical chemistry, Ishikawa diagrams are used to indicate sources of measurement uncertainty. See Fig. 1. 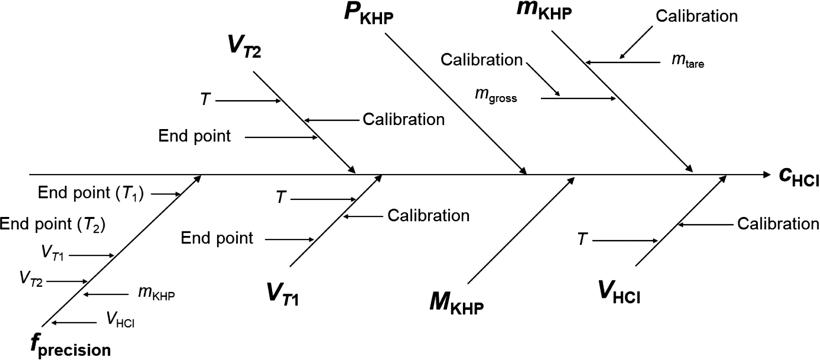
Figure 1: Ishikawa diagram for the titration of a hydrochloric acid solution with sodium hydroxide solution that has been standardized using potassium hydrogen phthalate (KHP). When used for identification of sources of measurement uncertainty, the diagram illustrates how the quantity value of the measurand (\(c_{\ce{HCl}}\)) depends on input quantities in a measurement model (symbols in bold), which in turn depend on other quantities. Symbols have their usual meanings. \(f_{\rm{precision}}\) is a is a factor in the measurement function to account for measurement precision with value 1 and standard measurement uncertainty.