https://doi.org/10.1351/goldbook.08140
Graphical technique for evaluating an interlaboratory comparison when each participant has made two measurements on the same sample or one measurement on each of two different samples.
Notes:
- The coordinates of each point may be the measured quantity values themselves or any transformation thereof such as a performance score, for example, a \(z\) score (see Fig. 1).
- The Youden plot is a simple but effective method for comparing both within-laboratory variability and between-laboratory variability.
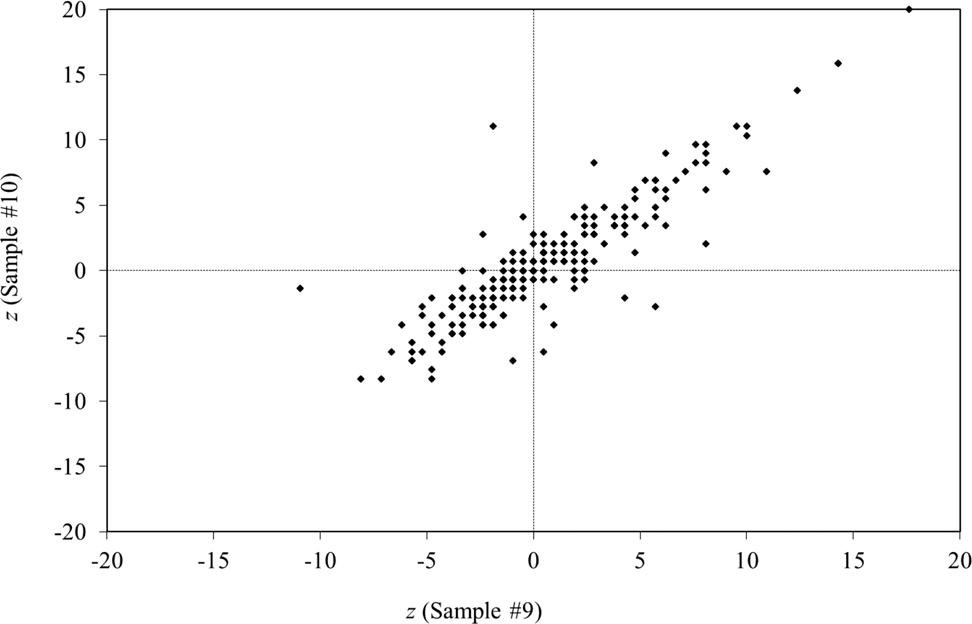
Figure 1: Youden plot of the \(z\) scores of samples #9 and #10 of Round 5 of U39 of the proficiency testing program held by the RCPA Australia for the analysis of creatinine in urine by 218 laboratories. (Reproduced with permission).