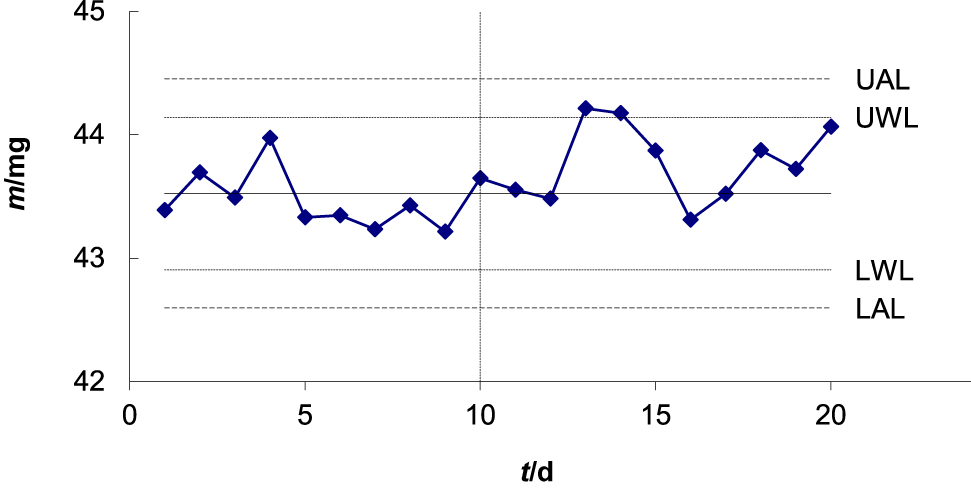
Figure 1: Shewhart means chart of the means of duplicate analyses of a quality control material, twice per day (d) over 20 days. Each point is the mean of the day’s four results (\(n = 4\)). Upper and lower warning limits (UWL and LWL) are at \(\bar{x} \pm 2s/\sqrt{n}\), where \(\bar{x}\) is the process mean, \(s\) is the standard deviation under repeatability conditions of measurement, and upper and lower action limits (UAL and LAL) are at \(\bar{x} \pm 3s/\sqrt{n}\). A simulated measurement bias of one standard deviation is applied after day 10.
Figure 1: Shewhart means chart of the means of duplicate analyses of a quality control material, twice per day (d) over 20 days. Each point is the mean of the day’s four results (\(n = 4\)). Upper and lower warning limits (UWL and LWL) are at \(\bar{x} \pm 2s/\sqrt{n}\), where \(\bar{x}\) is the process mean, \(s\) is the standard deviation under repeatability conditions of measurement, and upper and lower action limits (UAL and LAL) are at \(\bar{x} \pm 3s/\sqrt{n}\). A simulated measurement bias of one standard deviation is applied after day 10.